Consider below the branching tree diagram based on the number per 3000 American adults. 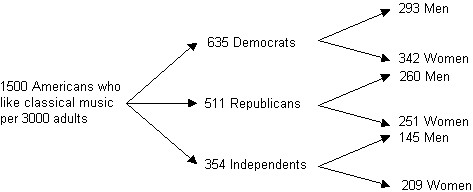 LetT = the set of Americans who like classical music R = the set of Republicans who like classical music D = the set of Democrats who like classical music I = the set of Independents who like classical musicDetermine whether the statement is true or false.R ? T
A. True
B. False
Answer: B
Mathematics
You might also like to view...
Decide whether the relation is a function.{(-9, 4), (-9, -3), (1, -3), (5, -3), (9, -7)}
A. not a function B. function
Mathematics
Decide whether the statement is true or false.The circle with equation (x + 4)2 + (y - 4)2 = 64 has center at (4, -4).
A. True B. False
Mathematics
Convert as indicated.3.31 kg to grams
A. 0.0331 g B. 331 g C. 0.00331 g D. 3310 g
Mathematics
Tell which of the following types of regression is likely to give the most accurate model for the scatter plot shown: linear regression, quadratic regression, cubic regression, exponential regression, sinusoidal regression.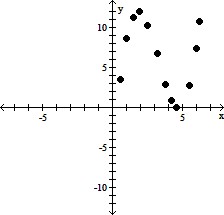
A. Linear regression B. Cubic regression C. Quadratic regression D. Exponential regression E. Sinusoidal regression
Mathematics