Refer to the figure below.________ inflation will eventually move the economy pictured in the diagram from short-run equilibrium at point ________ to long-run equilibrium at point ________, 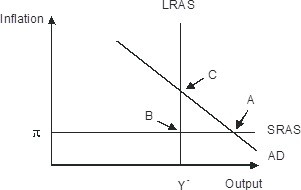
A. Rising; B; C
B. Falling; A; C
C. Falling; A; B
D. Rising; A; C
Answer: D
You might also like to view...
In the late 1980s and the early 1990s, the Fed followed a policy of
a. controlling the money supply to stimulate investment b. decreasing interest rates to stimulate investment c. fixing the money supply at a constant rate of growth in order to stimulate investment d. allowing the money supply to increase in order to stimulate international trade e. selling its government bonds in order to reduce the size of the federal government's debt
Which of the following is not included in the current account of a nation's balance of payments?
A) Its goods exports. B) Its goods imports. C) Its net investment income. D) Its purchases of real assets abroad.
Kristi and Rebecca sell lemonade on the corner. It costs them 7 cents to make each cup. On a certain day, they sell 40 cups. Their producer surplus for that day amounts to $19.20 . Kristi & Rebecca sold each cup for
a. 31 cents. b. 38 cents. c. 45 cents. d. 55 cents.
If the marginal propensity to consume = 0.75, then:
A. the marginal propensity to save = 0.75. B. the marginal propensity to save = 1.33. C. the marginal propensity to save = 0.20. D. the marginal propensity to save = 0.25.