Solve the problem.The graph below shows the number of tuberculosis deaths in the United States from 1989 to 1998.
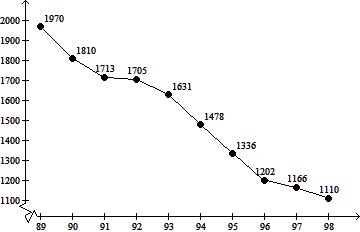 YearEstimate the average rate of change in tuberculosis deaths from 1991 to 1996.
A. About -60 deaths per year
B. About -0.9 deaths per year
C. About -100 deaths per year
D. About -500 deaths per year
Answer: C
You might also like to view...
Determine whether the source of error represents random or systematic error.A study is conducted to assess the effectiveness of vaccinations. If a person has been vaccinated against the measles, and the doctor knows this, the doctor is less likely to diagnose an illness as measles.
A. Systematic error B. Random error
Solve the problem.Find the magnitude of the torque in foot-pounds at point P for the following lever: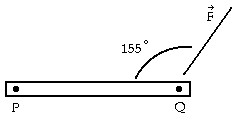
 = 3 in. and
  = 20 lb
A. 9.72 ft-lb B. 4.53 ft-lb C. 2.11 ft-lb D. 60 ft-lb
Solve.A cyclist bikes at a constant speed for 20 miles. He then returns home at the same speed but takes a different route. His return trip takes one hour longer and is 25 miles. Find his speed.
A. 5 mph B. 4 mph C. 7 mph D. 6 mph
Perform the indicated operations and simplify the result. Leave the answer in factored form. ?
? 
A. 
B. 
C. 
D. 