Based on the figure below. Starting from long-run equilibrium at point C, a tax cut that increases aggregate demand from AD to AD1 will lead to a short-run equilibrium at point ________ and eventually to a long-run equilibrium at point ________, if left to self-correcting tendencies. 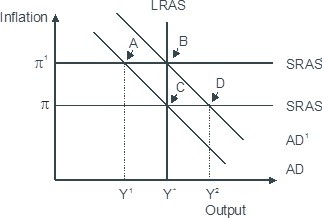
A. D; C
B. B; C
C. B; A
D. D; B
Answer: D
You might also like to view...
At a competitive market equilibrium, if there are no taxes, subsidies, price regulations, quantity regulations, or externalities, i. consumer surplus is minimized. ii. marginal cost equals marginal benefit. iii. resources are efficiently used
iv. producer surplus is minimized. A) ii and iii B) i and ii C) i and iv D) i, ii, iii, and iv E) ii only
Two-dimensional graphs have a horizontal and a vertical axis and are used in economics to illustrate
A) relationships between two economic variables. B) a pie chart. C) a flow chart. D) one variable.
Refer to the figure above. The quota generates deadweight costs of
A) $10,000. B) $12,000. C) $30,000. D) $50,000.
Money is more mobile geographically now than in the past
Indicate whether the statement is true or false