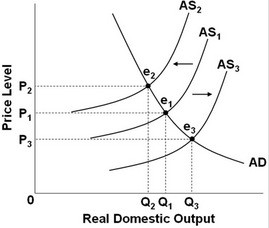
 Refer to the above diagram. Cost-push inflation can be illustrated by a:
A. shift in the aggregate supply curve from AS2 to AS3.
B. shift in the aggregate supply curve from AS1 to AS3.
C. shift in the aggregate supply curve from AS1 to AS2.
D. movement along the aggregate demand curve from e1 to e3.
Answer: C
You might also like to view...
When a supply shock is permanent
A) both the long-run and short-run aggregate supply curves shift leftward. B) there are no shifts in either the long-run or short-run aggregate supply curve. C) only the long-run aggregate supply curve shifts leftward. D) only the short-run aggregate supply curve shifts leftward.
Kirk consumes normal goods. If Kirk's income decreases and the prices of all goods remain unchanged, in his new consumer equilibrium, his marginal utility from each good will ________ and his total utility will ________
A) increase; increase B) increase; decrease C) decrease; increase D) decrease; decrease
A model (or theory):
a. is a general statement about the causal relationship between variables based on facts. b. helps explain and predict the relationship between variables. c. when expressed as a downward (negatively) sloping graph implies an inverse relationship between the variables. d. all of these.
In practice, the Board of Governors and the chairperson of the Federal Reserve have the real control over monetary policy.
Answer the following statement true (T) or false (F)