Determine whether the graph is that of a function. If it is, use the graph to find its domain and range, the intercepts, if any, and any symmetry with respect to the x-axis, the y-axis, or the origin.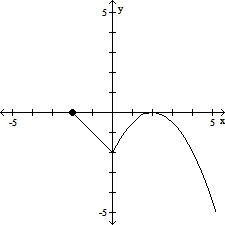
A. function
domain: all real numbers
range: all real numbers
intercepts: (-2, 0), (0, -2), (2, 0)
symmetry: none
B. function
domain: {x|x ? -2}
range: {y|y ? 0}
intercepts: (-2, 0), (0, -2), (2, 0)
symmetry: none
C. function
domain: {x|x ? 0}
range: {y|y ? -2}
intercepts: (-2, 0), (0, -2), (2, 0)
symmetry: y-axis
D. not a function
Answer: B
You might also like to view...
Multiply using Napier rods.4 × 1441
A. 5768 B. 5764 C. 2882 D. 11,528
Provide an appropriate response.Explain the difference between an independent and a dependent variable.
What will be an ideal response?
Use a graphing utility to graph the function and then answer the question.The polynomial function  represents the yearly income (or loss) from a real estate investment, where t is time in years. After what year does income begin to decline?
A. 13 B. 6.5 C. 5.5 D. 8.67
Determine whether the statement is an expression or an equation.4r + 2 = 22
A. Expression B. Equation