Using Figure 1 above, if the aggregate demand curve shifts from AD3 to AD2 the result in the long run would be: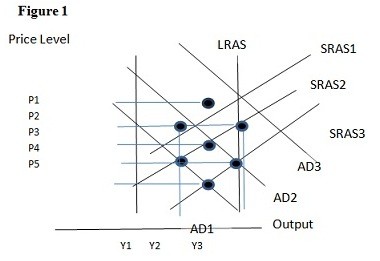
A. P1 and Y2.
B. P2 and Y1.
C. P3 and Y1.
D. P3 and Y2.
Answer: D
You might also like to view...
The employment-to-population ratio in the U.S. is expected to decline as the baby boom generation retires
a. True b. False
Taxes that distort economic decisions impose excess burdens.
Answer the following statement true (T) or false (F)
To increase output the government could adopt policies that
A. increase aggregate supply and decrease aggregate demand. B. increase aggregate supply and aggregate demand. C. decrease aggregate supply and increase aggregate demand. D. decrease aggregate supply and aggregate demand.
The degree to which gasoline and corn prices are linked is dependent on
A. government regulators. B. how high gasoline prices are, because when they are high, corn-based ethanol becomes a more attractive substitute. C. consumer driving habits. D. consumer tastes for corn.