The stack plot below shows the value of each of Danny's investments. The stack plot contains three regions. The uppermost unshaded region represents the value of Danny's investment in individual stocks. The center shaded region represents the value of Danny's investment in mutual funds and the bottom region in black represents the value of Danny's investment in a CD. The thickness of a region at a particular time tells you its value at that time.  Use the graph to answer the question.In year 0, approximately what percentage of Danny's total investment was in the CD?
A. 20%
B. 30%
C. 15%
D. 25%
Answer: A
Mathematics
You might also like to view...
Convert as indicated. If necessary, round to two decimal places.11 ounces to grams
A. 4.95 g B. 311.85 g C. 0.44 g D. 24.2 g
Mathematics
Find the length of the unknown side of the right triangle with legs a and b and hypotenuse c. Round to three decimal places, if necessary.a = 15, c = 39
A. b = 27 B. b = 36 C. b = 42 D. b = 37
Mathematics
Graph the parabola with the given equation.(y - 1)2 = 7(x + 1) 
A. 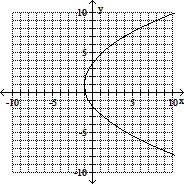
B. 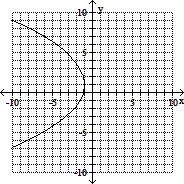
C. 
D. 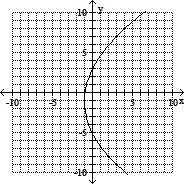
Mathematics
Verify the identity. = csc ? cot ?
What will be an ideal response?
Mathematics