Refer to the graph below. Assume the consumer has an income of $100, the price of X is $2 and the price of Y is $1. According to the graph below, the total effect of a decrease in the price of X from $2 to $1 is equal to: 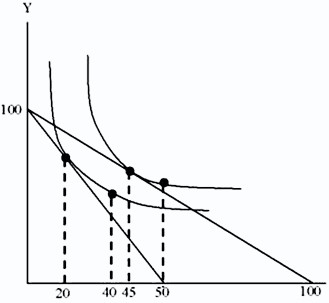
A. 25
B. 20
C. 30
D. 5
Answer: A
You might also like to view...
Monetarists believe that the aggregate supply curve is relatively steep in the short and long runs. This means they expect
a. inflation with no change in output. b. increases in output to bring much inflation. c. increases in output to bring little inflation. d. decreases in output to bring much inflation.
Suppose aggregate demand is too high to bring about the Natural Real GDP level. A Keynesian policy prescription would call for a(n) _____________________ to close this inflationary gap
A) increase in government spending B) decrease in government spending C) increase in taxes D) decrease in taxes E) b or c
One important current monetary policy question is
A. how long the fed funds rate has been near zero. B. whether quantitative easing can raise the funds rate back to a normal level. C. how soon to raise the fed funds rate back to a normal level. D. whether to raise the fed funds rate back to a normal level.
Accounting profit can be calculated as
A. total revenue - explicit costs. B. total revenue - explicit costs - implicit costs. C. total revenue - implicit costs. D. total revenue - opportunity costs.