The figure below shows a shift in the production-possibility curve of a country from AB to AC. Here, S1 and C1 are the initial production and consumption points, respectively. S2 and C2 are the final production and consumption points, respectively. Which of the following is illustrated by this figure?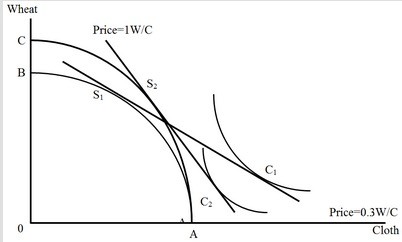
A. The benefits of trade in a small country
B. The mechanism of reversal in trade pattern
C. The immiserizing growth effect in a large country
D. The validity of the product cycle hypothesis
Answer: C
You might also like to view...
To calculate GDP using the expenditure approach, in part it is necessary to add exports and subtract imports
Indicate whether the statement is true or false
The income effect of a price increase for a Giffen good outweighs the substitution effect
Indicate whether the statement is true or false
Refer to Figure 9.2. At price 0E and quantity Q*, the deadweight loss is
A) 0ACQ*. B) 0ECQ*. C) 0FCQ*. D) EFC. E) none of the above
Purchasing power parity suggests that
a. Given fixed prices, interest rates adjust so that a good costs the same across two countries b. Given fixed exchange rates, prices adjust such that a good costs the same across two countries c. All of the above d. None of the above