Use the graph of f to determine the intervals where f is increasing and where f is decreasing.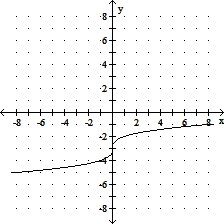
A. increasing: (-?, 0]; decreasing [0, ?)
B. increasing: [0, ?); decreasing (-?, 0]
C. increasing: (-?, ?); decreasing: never
D. increasing: never; decreasing: (-?, ?)
Answer: C
You might also like to view...
Insert ? or ? in the blank to make the statement true.{1, 3, 6, 8}  {1, 1, 3, 4, 5, 6}
A. ? B. ?
Use reduction formulas to evaluate the integral.
A. 8 sin 2x -  sin3 2x + C
B. 4 sin 2x -  cos3 2x + C
C. 4 sin 2x +  sin3 2x + C
D. 4 sin 2x -  sin3 2x + C
Express the data in the graph as ordered pairs, letting the first coordinate represent the year and the second coordinate the amount.Summer Vacation:The length of the average summer vacation is decreasing.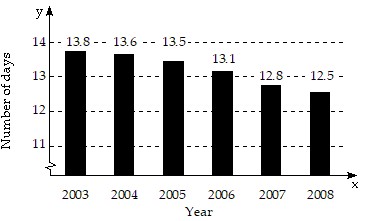
A. (2003, 13.6), (2004, 13.8), (2005, 13.1), (2006, 13.5), (2007, 12.8), (2008, 12.5) B. (13.6, 2003), (13.8, 2004), (13.5, 2005), (13.1, 2006), (12.5, 2007), (12.8, 2008) C. (13.8, 2003), (13.6, 2004), (13.5, 2005), (13.1, 2006), (12.8, 2007), (12.5, 2008) D. (2003, 13.8), (2004, 13.6), (2005, 13.5), (2006, 13.1), (2007, 12.8), (2008, 12.5)
Apply the quotient rule for exponents, if applicable, and write the result using only positive exponents. Assume all variables represent nonzero numbers.
A. x12
B. 
C. 
D. -x12