Use the following graph to answer the next question. 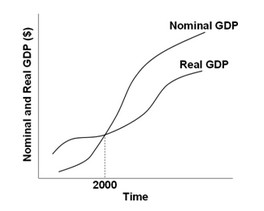 The graph suggests that the GDP price index during the period shown was generally ________.
A. decreasing
B. positive
C. constant
D. increasing
Answer: D
You might also like to view...
Which of the following is a public good created by the market?
a. Broadcast radio b. Tornado sirens c. Street lights d. Cable television
Bigness, or large firms, may benefit consumers in which of the following ways?
A. Larger firms usually charge lower prices than smaller firms. B. Larger firms with monopoly power definitely have greater incentive to be efficient and innovative. C. Larger firms may take advantage of economies of scale and scope. D. Larger firms are more responsive to consumers’ desires.
In the 1970s and 1980s our productivity
A. increased at an increasing rate. B. Increased at a decreasing rate. C. Stayed about the same. D. decreased.
If actual output equals potential output, unusually slow potential output growth would tend to result in:
A. a recession. B. an output gap. C. an expansion. D. a recessionary gap.