Solve the problem.The chart represents the amount of fuel consumed by a machine used in manufacturing. The machine is turned on at the beginning of the day, takes a certain amount of time to reach its full power (the point at which it uses the most fuel per hour), runs for a certain number of hours, and is shut off at the end of the work day. The fuel usage per hour of the machine is represented by a periodic function. What is the period in hours of this function?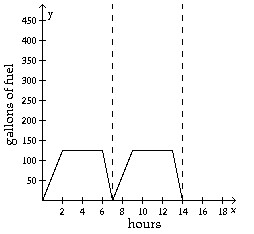
A. Period = 7 hours
B. Period = 125 hours
C. Period = 4 hours
D. Period = 14 hours
Answer: A
You might also like to view...
Solve the linear inequality. Graph the solution set on a number line, and express the solution using interval notation.-3x - 2 ? -4x - 1![]()
A. (-?, 1)![]()
B. [-3, ?)![]()
C. (-?, 1]![]()
D. [1, ?)![]()
Find the product.(3x - 6y)(5x + 9y + 1)
A. 15x2 - 3xy - 3y2 B. 15x2 + 27xy + 3x - 54y2 C. 15x2 - 3xy + 3x - 54y2 - 6y D. 15x2 - 30xy + 3x - 54y2 - 6y
Graph the function.f(x) = log x 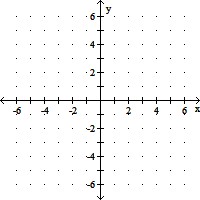
A. 
B. 
C. 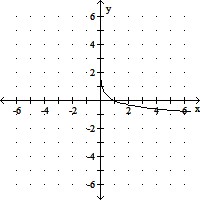
D. 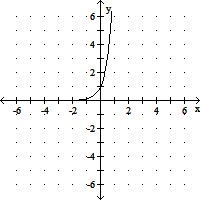
Solve the problem.The table shows the population of a city over the past five years.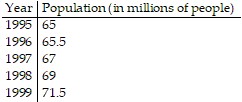 We used these data to develop the quadratic equation
 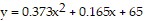 , which models the population of the city y in millions in the year x, where x = 0 represents 1995, x = 1 represents 1996, and so on. Use the model to find the estimated population in the year 1998.
A. 1,490,000 B. 71,628,000 C. 68,852,000 D. 1,490,000,000,000