Refer to the information provided in Figure 2.4 below to answer the question(s) that follow.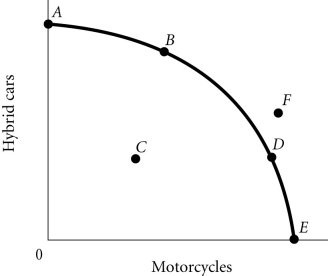 Figure 2.4According to Figure 2.4, an increase in unemployment may be represented by the movement from
A. B to A.
B. A to C.
C. C to D.
D. B to D.
Answer: B
You might also like to view...
Economic growth is the result of all of the following EXCEPT
A) technological change. B) capital accumulation. C) opportunity cost. D) investment in human capital.
In a coin toss bet, where both heads and tails are equally likely, you win a $2 on heads but lose $1 on tails. The expected value of the bet is
a. $0.50 b. -$0.50 c. $1.00 d. $0.00
Suppose hypothetically that you buy a lot of food such as tofu, veggie burgers, and organic fruit that are not included in the market basket used to compute the CPI. In addition, suppose that all of these goods have become cheaper over the last year, while the overall CPI has increased by 6 percent. Then which of the following is true? a. The CPI will understate the negative impact of inflation
on your purchasing power and standard of living. b. The CPI will still accurately state the negative impact of inflation on your purchasing power and standard of living. c. The CPI will overstate the negative impact of inflation on your purchasing power and standard of living. d. None of the answers above are correct.
If the average price level in 2002 was 1.25 relative to the base year in 1992, then:
a. a dollar in 2002 bought just 80 percent of the goods and services that a dollar bought in 1992. b. average prices were 80 percent higher in 2002 than in 1992. c. a dollar in 2002 bought 25 percent more goods and services than a dollar bought in 1992. d. average prices were 125 percent higher in 2000 than in 1992. e. purchasing power rose 25 percent between 1992 and 2002.