The bar graph shows the number of new residents in several towns during the years 1999 to 2001. Use the graph to answer the question. 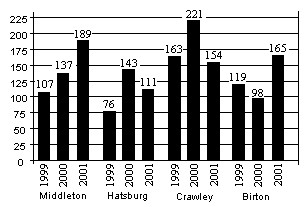 In the year 2000, how many more new residents did Crawley have than Middleton?
A. 35
B. 78
C. 32
D. 84
Answer: D
Mathematics
You might also like to view...
Solve the problem.A cylinder is to have a height that is 14 feet less than the radius. Write an expression for the volume of the cylinder in terms of the radius
A. ? r3 - 196? r2 B. ? r3 + 14? r2 C. 2? r2 - 28? r D. ? r3 - 14? r2
Mathematics
Use your graphing calculator to convert to polar coordinates. Round all values to four significant digits.
?
 ?
?
A. 
B. 
C. 
D. 
E. 
Mathematics
Solve. - 3 = 14
A. {17, 11} B. {-5, 11} C. {-23, 11} D. {-11, 11}
Mathematics
Does the graph represent a function that has an inverse function?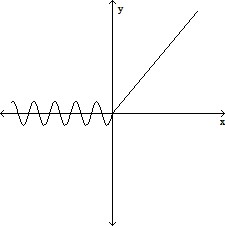
A. Yes B. No
Mathematics