Using Figure 1 above, if the aggregate demand curve shifts from AD1 to AD2 the result in the long run would be: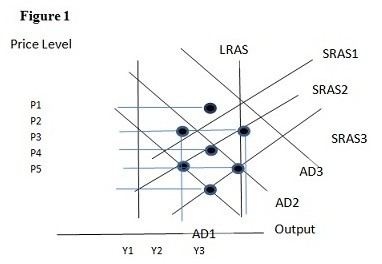
A. P1 and Y2.
B. P2 and Y2.
C. P3 and Y1.
D. P2 and Y3.
Answer: D
You might also like to view...
In the figure above, in order to promote an efficient allocation of resources, the government could impose a tax equal to
A) zero. B) $250 per unit. C) $150 per unit. D) $100 per unit.
Say's law says that
A) consumption is greater than supply. B) desired expenditures always equal actual expenditures. C) people produce the goods they consume. D) people consume the goods they produce.
All of the points inside a production possibilities frontier are ____; all of the points outside the production possibilities frontier are ____
a. efficient, inefficient b. optimal, irrational c. attainable, unattainable d. rational, zero-cost e. unattainable, efficient
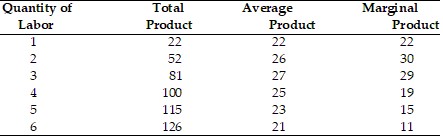 Refer to the above table. At what quantity of labor is the average product of labor maximized?
A. 2 units B. 1 unit C. 6 units D. 3 units