Plot the demand for caviar given the following information on quantity consumed and total utility; then explain why caviar sells for such a high price.
Quantity
(in ounces)
Total Utility
(in dollars)
1 50 2753 884 95 599?
What will be an ideal response?
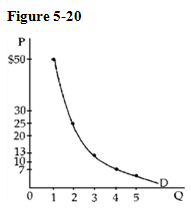
To plot demand, find marginal utility for each ounce of caviar and plot quantity and MU (see Figure 5-20). At Q = 1, plot $50, at Q = 2, plot 25, . . . , at Q = 5, plot 4.
Caviar is a product for which there is a small supply, so the price can be as high as $50 an ounce (if S intersects D at one ounce). A larger supply would drop P to $25 (if S intersects D at Q = 2), etc.
You might also like to view...
Refer to Figure 12.6. Under a fixed exchange rate system, the central bank cannot increase the output gap with expansionary policy and still maintain the fixed exchange rate if the economy is at
A) point A. B) point B. C) point C. D) point X.
In the real world, ____ factors that affect demand and supply can change at once.
a. many b. isolated c. no d. psychological
Vertical equity refers to the notion that individuals at all levels should be taxed equally
a. True b. False Indicate whether the statement is true or false
What effect does the number of firms in an oligopoly have on the characteristics of the market?