Solve the problem.The following graph shows the private, public and total national school enrollment for students for select years from 1970 through 2000.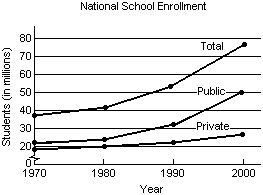 i) How is the graph for total school enrollment, T, determined from the graph of the private enrollment, r, and the public enrollment, u?ii) During which 10-year period did the total number of students enrolled increase the least?iii) During which 10-year period did the total number of students enrolled increase the most?
A.
| i) | T is the sum of r and u. |
iii) 1990-2000
B.
| i) | T is the sum of r and u. |
iii) 1970-1980
C.
| i) | T is the difference of r and u. |
iii) 1990-2000
D.
| i) | T is the sum of r and u. |
iii) 1980-1990
Answer: A
Mathematics
You might also like to view...
Identify the property illustrated by the statement.9 + (-9) = 0
A. Addition property B. Additive identity C. Multiplicative identity D. Inverse property of addition
Mathematics
Find an equivalent expression by factoring.2x - 6y
A. 2(1 - 3y) B. 2(x - 6y) C. -4xy D. 2(x - 3y)
Mathematics
Test the equation for symmetry with respect to the specified axis, line, or pole.r = 4 + 2 sin ?; the y-axis 
A. May or may not be symmetric about the y-axis B. Symmetric about the y-axis
Mathematics
Find the slope of the line containing the two points.(8, -3); (-8, 6)
A. 
B. - 
C. 
D. - 
Mathematics