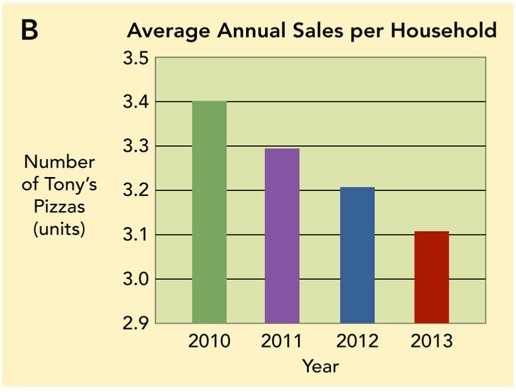
 Figure 7-6B: Average Annual Sales of Tony's Pizza per HouseholdFigure 7-6B above shows that
A. average annual unit sales of Tony's Pizza per household decreased over the period 2010 and 2013.
B. average dollar sales of Tony's Pizza have dropped from $3.4 million to $3.1 million.
C. smaller households bought less Tony's Pizza over the period 2010 and 2013.
D. sales of Tony's Pizza to households with children declined over the period 2010 and 2013.
E. annual sales of Tony's Pizza increased over the period 2010 and 2013.
Answer: A
You might also like to view...
The Federal Trade Commission, under the FTC Act, protects consumers against
A) Deception. B) Unfairness. C) Breaches in privacy. D) All of the above. E) B and C.
The complex adaptive systems perspective ______ the notion of the organization as a machinelike set of interconnected and systematized parts that form a predictable whole.
a. accepts b. believes c. rejects d. asserts
Holding large inventories provides protection against stock-outs and lost sales.
Answer the following statement true (T) or false (F)
The Clayton Act regulates all but which of the following?
A) Price discrimination B) Tying contracts and mergers C) Exclusive dealing by labor organizations D) Interlocking directorates