Refer to the following graphs.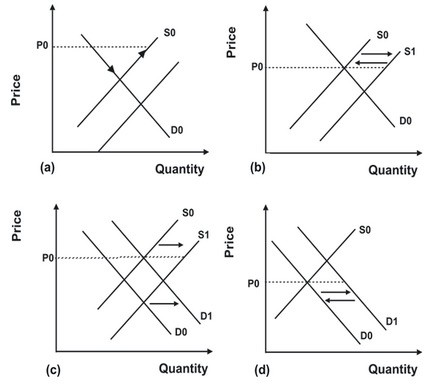 In the early 1990s, mounds of newspapers and worthless plastic piled up at recycling centers. As the nation's economy continued to grow, increased demand eliminated the mounds and turned them into shortages. In the mid-1990s, as recycling became more popular, the mounds of recycled materials returned. What graph best depicts these events on the market for recycled materials?
A. Price remained constant at P0. Demand shifted from D0 to D1 and then back to D0.
B. Price remained constant at P0. Supply first shifted from S1 to S0 and then back to S1.
C. Price remained constant at P0. Demand shifted from D0 to D1 then supply shifted from S0 to S1.
D. Price remained constant at P0. Quantity demanded first rose, while supply remained constant; quantity supplied then rose, while demand remained constant.
Answer: C
You might also like to view...
Refer to Figure 13-2. Ceteris paribus, a decrease in the capital stock would be represented by a movement from
A) SRAS1 to SRAS2. B) SRAS2 to SRAS1. C) point A to point B. D) point B to point A.
A firm currently employs five units of capital. When the firm adds a sixth unit of capital, it is able to reach a lower average cost for a greater quantity of output
What does this tell you about the shape of the long-run average cost curve and are economies of scale occurring? Explain briefly. Does this necessarily imply increasing or decreasing returns to scale in production or is it ambiguous? Explain briefly.
Compared to perfect competition, monopoly in the long run
a. restricts output. b. charges a higher price. c. produces at less than minimum average cost. d. All of the above are correct.
The President receives economic policy advice from economists at each of the following except
a. the Council of Economic Advisors. b. the Department of the Treasury. c. the Congressional Budget office. d. the Department of Labor.