Solve the problem.For some reason the quality of production decreases as the year progresses at a light bulb manufacturing plant. The following data represent the percentage of defective light bulbs produced at a light bulb manufacturing plant in the corresponding month of the year.  Use linear regression to predict in which month the percentage of defective light bulbs would be 1.83%.
A. May
B. February
C. April
D. March
Answer: C
You might also like to view...
For the given data value, find the standard score and the percentile.A data value 2.3 standard deviations below the mean.
A. z = -2.3; percentile = 1.07 B. z = -2.3; percentile = 98.93 C. z = -0.23; percentile = 40.13 D. z = 2.3; percentile = 98.93
Simplify the polynomial by adding or subtracting, as indicated. Express your answer as a single polynomial in standard form.Find the sum of (8x6 - 6x4) and (4x6 + 9x4 + 3).
A. 12x11 B. 3x + 3x6 - 3x4 C. 12x6 + 3x4 + 3 D. -2x6 + 17x4 + 3x
Two lines intersect with angle ? as shown in the figure.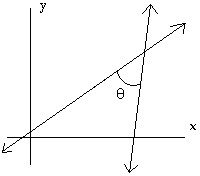 Find ? to the nearest degree for the two intersecting lines given by
 and

A. 173° B. 45° C. 30° D. 135°
Solve using Cramer's rule. y + 3z = 42x - 4z = 8 x + 6y = -7
A. 
B. 
C. 
D. 