The boxplot represents a comparison of the annual salaries of a group of public and private employees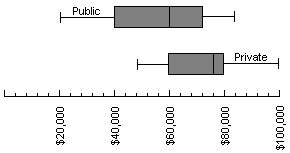
Determine the five-number summary and IQR for the salaries of the public employees.
A. Min = $48,000, Q1 = $60,000, Median = $76,000, Q3 = $80,000, Max = $100,000, IQR = $20,000
B. Min = $20,000, Q1 = $40,000, Median = $60,000, Q3 = $72,000, Max = $84,000, IQR = $32,000
C. Min = $40,000, Q1 = $48,000, Median = $60,000, Q3 = $72,000, Max = $80,000, IQR = $24,000
D. Min = $20,000, Q1 = $40,000, Median = $60,000, Q3 = $66,000, Max = $82,000, IQR = $26,000
Answer: B
You might also like to view...
Calculate the derivative of the function. Then find the value of the derivative as specified.f(x) = x2 + 7x - 2; f '(0)
A. f '(x) = x + 7; f '(0) = 7 B. f '(x) = 2x + 7; f '(0) = 7 C. f '(x) = 2x - 2; f '(0) = - 2 D. f '(x) = 2x; f '(0) = 0
Determine the coordinates of the points shown. Tell in which quadrant the point lies. Assume the coordinates are integers. 
A. (-6, -8); quadrant IV B. (-6, -8); quadrant III C. (-6, -4); quadrant IV D. (-6, -4); quadrant III
Divide.(35x2 + 34x + 8) ÷ (5x + 2)
A. 7x + 4 B. x + 4 C. 4x + 1 D. 35x + 4
Simplify, if possible, by combining like terms.-2b2 - 7b2 - 6b2
A. -9b4 - 6b2 B. -9b2 - 6 C. -15b2 D. -15b6