Refer to the table above. If there is no statistical discrepancy, the sum of all three balance of payments accounts equals
A) -$20 billion.
B) +$220 billion.
C) +$20 billion.
D) zero
E) +$200 billion.
D
You might also like to view...
Suppose we have normally-sloped IS and LM curves intersecting at point A. Then a monetary policy change shifts the LM curve to the right. Directly below point A we find a point on the new LM curve that shows us
A) where the new IS-LM equilibrium occurs. B) how much the interest rate must fall to raise planned expenditures to the new equilibrium income. C) how much the interest rate must fall to by itself raise the demand for money by as much as the money supply has decreased. D) how much income must rise to by itself raise the demand for money by as much as the money supply has increased. E) how much the interest rate must fall to by itself lower the demand for money by as much as the money supply has decreased.
Which of the following correctly describes the Lorenz curve?
a. The Lorenz curve shows that the increasing income inequality in the U.S. society is actually good for the economy. b. The Lorenz curve shows the growth rate in real median family income over time. c. The Lorenz curve shows the cumulative distribution of family income, ranked from the poorest to the richest families, and compares that curve with the straight line indicating perfectly equal income distribution. d. The Lorenz curve shows the cumulative distribution of family income, ranked from the richest to the poorest families, and compares that curve with the ideal of having all income go to the richest 5 percent of society.
The demand for novels is ________ than is the demand for science textbooks because ________.
A. less price elastic; novels have less available substitutes. B. less price elastic; novels have more available substitutes. C. more price elastic; novels have more available substitutes. D. more price elastic; novels have less available substitutes.
The marginal physical product of the third unit of labor in Figure 21.1 is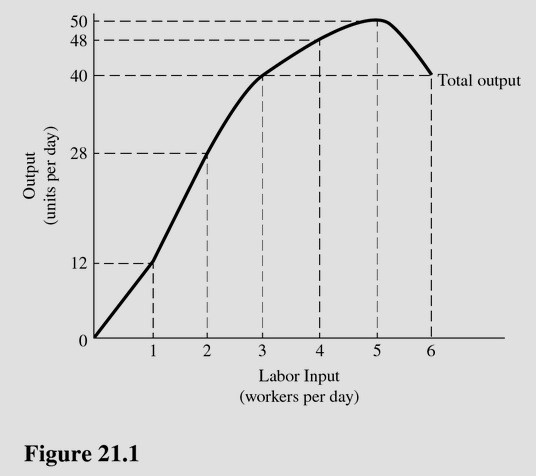
A. 12.0 units per day. B. 13.3 units per day. C. 40.0 units per day. D. 4.0 units per day.