The Preview discusses the choice of going to college or not. Use the internet to examine educational attainment by race, Hispanic origin, and gender. The table of contents and data found in the Statistical Abstract of the United States. Click on the tables for Education Attainment. Use the data in this table to create a graph
Plot the percentage of each group that had 4 years or more of college on the vertical axis. Plot the year on the horizontal axis.
Questions
- Which group has the highest percentage with 4 or more years of college?
- What could explain the difference between males and females?
- Which two races have the greatest differentials between males and females in educational attainment?
Solutions:
- White males have the highest percentage with 4 or more years of college.
- Differences between males and females could be explained by a number of reasons. Try to gear student discussion toward choices and opportunity cost differences between the sexes.
- Asian/Pacific Islanders and Whites have the greatest differentials between males and females in educational attainment.
You might also like to view...
If this is a closed economy how many cars will be exchanged? 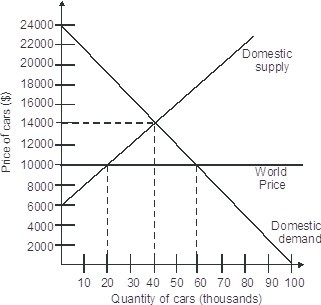
A. 80,000 B. 20,000 C. 60,000 D. 40,000
Which of the following would not be considered a market distortion:
a. minimum wage b. union-negotiated wage c. monopsony wage d. efficiency wage e. all of the above are market distortions
Which of the following groups has the lowest poverty rate?
a. blacks b. Asians c. children (under age 18) d. female households, no spouse present
The average total cost (ATC) curve will be downward sloping so long as
A. Average variable cost is less than average total cost. B. Marginal cost is less than average total cost. C. Average fixed cost is less than average total cost. D. Marginal cost is greater than average total cost.