The following graph shows the populations of the metropolitan areas of City X and City Y over six years.  At the time when the populations of the two metropolitan areas were equal, what was the approximate population of each area?
A. about 0.95 million
B. about 0.87 million
C. about 0.92 million
D. about 1.03 million
Answer: B
Mathematics
You might also like to view...
Rewrite the expression using the Distributive Property and simplify the result.-1 ? (2x - 4)
A. -2x - 4 B. 8x C. -2x + 4 D. 2x - 4
Mathematics
Simplify the expression.4[-5 + 3(-5 + 7)]
A. 4 B. -14 C. -16 D. -20
Mathematics
Find the area of the rectangle.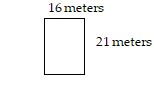
A. 336 sq m B. 672 sq m C. 37 sq m D. 74 sq m
Mathematics
Convert the number in the sentence to standard notation.The total sales of Acme Manufacturing Company for the years 1996-2000 was $63.40 billion.
A. $63,400,000,000 B. $63,400,000 C. $63,400,000,000,000 D. $634,000,000
Mathematics