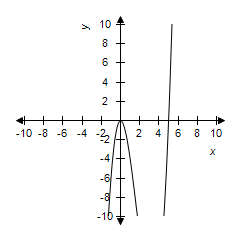
Select the graph of the function and determine the zeros of the polynomial.
?

?
A. ?


?
B. ?

?
C. ?


?
D. ?


?
E. ?


?
Answer: A
You might also like to view...
Solve the problem.A study was conducted to compare the average time spent in the lab each week versus course grade for computer students. The results are recorded in the table below. By using linear regression, the following function is obtained:  where x is the number of hours spent in the lab and y is the grade on the test. Use this function to predict the grade of a student who spends 14 hours in the lab. Round to the nearest tenth. Number of hours spent in lab Grade (percent) 10 96 11 51 16 62 9 58 7 89 15 81 16 46 10 51
A. 62.6 B. 74.6 C. 65.4 D. 58.6
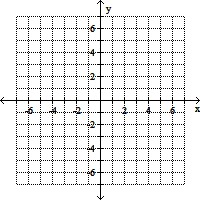
Plot the point and state the quadrant, if any, in which the point is located.(4, 6)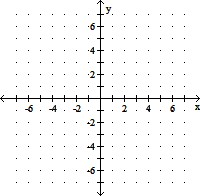
A. Quadrant I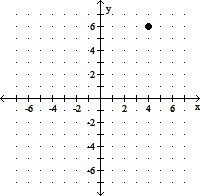
B. Quadrant II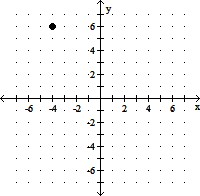
C. Quadrant IV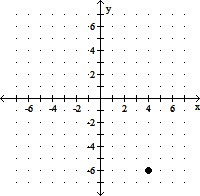
D. Quadrant I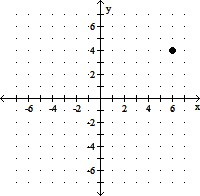
Solve the linear equation.12w + 15 - 15w + 17w = 8 + 56 - 24w + 10w + 7
A. 2 B. -3 C. -2 D. 3
Find the solution(s) (if any) of the system of equations by the graphical method. If the equations are dependent, write your answer with x being arbitrary.
A. inconsistent
B. {(2, 1)}
C. 
D. {(1, 2)}