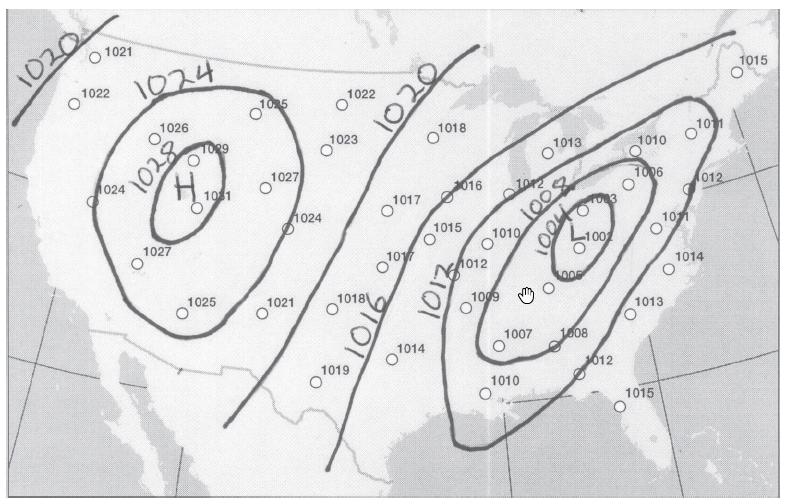
This map is a simplified weather map of the United States showing surface pressure conditions in millibars (here written out in full form). Draw in all of the appropriate isobars at 4 mb intervals. Your highest isobar value will be 1028 mb (the sequence of isobars will be 1028 mb, 1024 mb, 1020 mb, 1016 mb, etc.). Label each isobar. There is one high pressure center and one low pressure center on the map—label each appropriately (“H” or “L”). Begin by drawing your isobar lines lightly in pencil until you are certain of their location. For a review of drawing isolines in general, refer to Exercise 6. Hint: First draw in the 1020 mb isobar that will run from northeast to southwest across the middle of the country; next enclose the high pressure center; finally, enclose the low
pressure area.
What will be an ideal response?
You might also like to view...
Photosynthesis
a. converts glucose into energy and water b. requires the combustion of carbon c. produces carbon dioxide and oxygen gas d. yields glucose and oxygen gas as products e. yields glucose and carbon dioxide as products
You are asked to develop a vector-based index model. The model computes the index value using elevation and slope:Index value = 2 * elevation + slopeThe scoring (data standardization) systems for elevation and slope are as follows:ElevationScoreSlopeScore<= 1000'3<= 10%3> 1000'1> 10%1 You already have the elevation and slope layers. Describe the procedure you will follow to complete the task.
What will be an ideal response?
Businesses facing environmental regulations often try to have people from their industry appointed to high positions within the corresponding regulatory agencies.
Answer the following statement true (T) or false (F)
The Ural Mountains typically separate Europe and Russia and are some of the tallest mountains on earth
Indicate whether the statement is true or false