Figure 10-2
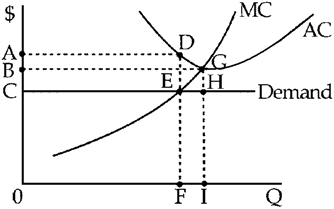
Figure 10-2 shows demand and short-run cost curves for a perfectly competitive firm. At its profit-maximizing level of output, the firm's short-run TC is represented by area
a.
ADFO.
b.
BGHC.
c.
BGIO.
d.
ADGIO.
a
You might also like to view...
In the figure above, if Mac and Izzie both completely specialized and traded with one another, their joint output would be
A) 3 computers and 3 TV sets per month. B) 6 computers and 6 TV sets per month. C) 12 computers and 12 TV sets per month. D) 24 computers and 24 TV sets per month.
According to Friedman and Phelps, which of the following statements is a correct characterization of unemployment and inflation in the United States since the 1950s?
A) A trade-off between inflation and unemployment as pictured in the Phillips curve existed over the entire time period. B) A trade-off between inflation and unemployment as pictured in the Phillips curve existed in the 1970s and 1980s, but not over the entire period. C) The relationship between inflation and unemployment is very different from the Phillips curve. A positive relationship is evident rather than an inverse relationship. D) There is no clear relationship between unemployment and inflation.
If population is expanding at a faster rate than a country's real output is expanding: a. real per capita output would increase
b. real per capita output would decrease. c. the production possibilities curve for the country as a whole will be shifting outward. d. both (b) and (c) would be true.
Suppose that alcohol consumption creates a negative externality. What can the government do to equate the equilibrium quantity of alcohol and the socially optimal quantity of alcohol?
a. impose a tax on alcohol that is equal to the per-unit externality b. offer a subsidy on alcohol that is equal to the per-unit externality c. impose a regulation limiting the amount of alcohol that each consumer can purchase d. nothing