According to the graph shown, if Q2 units are being produced, this monopolist:
This graph shows the cost and revenue curves faced by a monopoly.
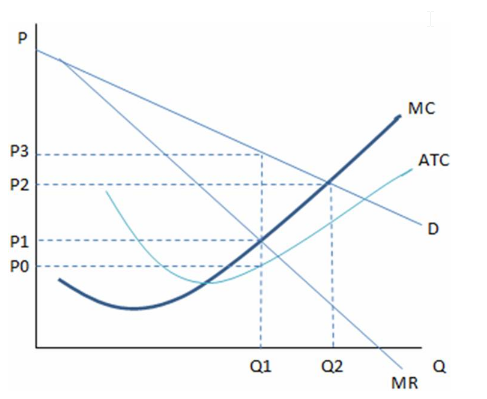
A. is earning negative profits.
B. should cut back production to increase profits.
C. is maximizing revenue.
D. is maximizing profits.
B. should cut back production to increase profits.
You might also like to view...
Refer to the table above. If the market price of wine is $4/bottle, and the market demand for wine is 65 bottles, Sandra's demand for wine is:
A) 18 bottles. B) 40 bottles. C) 47 bottles. D) 111 bottles.
Suppose a share of stock is expected to pay an annual dividend of $10 forever. At a discount rate of 5 percent, the share's market price should be
A) $188.24. B) $200.00. C) $29.60. D) $10.80.
What is scarcity and why does it exist? How is scarcity related to the study of economics?
Explain the major differences between the Federal Reserve and the U.S. Treasury