Refer to the information provided in Figure 3.11 below to answer the following question(s).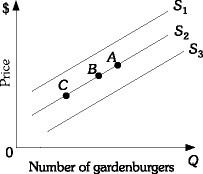 Figure 3.11Refer to Figure 3.11. A decrease in quantity supplied is represented by a movement from
A. Point B to Point C along supply curve S2.
B. Point B to Point A along supply curve S2.
C. S2 to S3.
D. S2 to S1.
Answer: A
You might also like to view...
Each firm in the egg industry (competitive) produces 15 million eggs per year. Each egg has an average cost of $0.02 and they sell an egg for $0.06 . The marginal cost of a string is
a. $0.02 b. $0.06 c. $0.04 d. not enough information provided.
The production possibilities frontier for a country is usually drawn
a. as a straight line, sloping downward. b. as a straight line, sloping upward. c. bowed outward from the origin. d. bowed inward toward the origin. e. as a dotted line when sloping downward and as a full line when sloping upward.
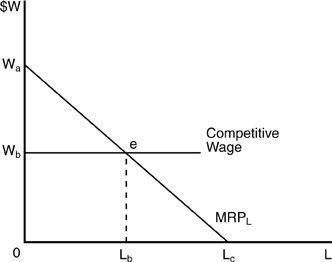 In the above figure, the line labeled "MRPL" also represents the firm's
A. total physical product curve. B. marginal physical product curve. C. supply curve. D. demand curve for labor.
Discuss the problem of population in developing nations using the rule of 70.
What will be an ideal response?