Solve by graphing.In one U.S. town the annual consumption y of beef (in kg per person) can be estimated by the linear equation  where x is the number of years since 1975. Graph the equation and use the graph to estimate the beef consumption in the year 1995.
A. 30 kg per person
B. 13 kg per person
C. 16 kg per person
D. 10 kg per person
Answer: C
You might also like to view...
Find the volume of the solid generated by revolving the region bounded by the given lines and curves about the  . y = 3cos ?x, y = 0, x = -0.5, x = 0.5
A.  ?
?
B. 3?
C. 18?
D. 9?
Find the y-intercepts for the parabola whose equation is given. If the y-intercepts are irrational, round your answers to the nearest tenth.y = x2 + 4x
A. y-intercept (0, 0) B. No y-intercept C. y-intercept (0, 4) D. y-intercepts (0, 0) and (-4, 0)
Evaluate the expression for the given replacement values. Write the answer in simplest form.x ÷ y for x = -  , y =
, y = 
A. - 
B. 
C. 
D. - 
Graph the function. Identify the vertex, x-intercepts, and the equation for the axis of symmetry.f(x) = x2 - 1
A. 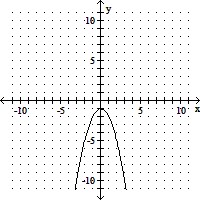
vertex: (0, -1)
x-intercepts: none
axis of symmetry: x = 0
B. 
vertex: (-1, 0)
x-intercept: (-1, 0)
axis of symmetry: x = -1
C. 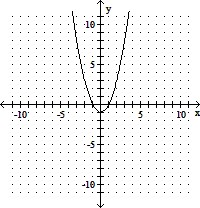
vertex: (0, -1)
x-intercepts: (-1, 0) and (1, 0)
axis of symmetry: x = 0
D. 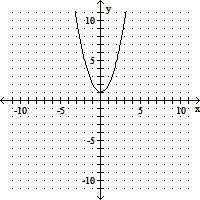
vertex: (0, 1)
x-intercepts: none
axis of symmetry: x = 0