A newspaper article discussing whether Social Security could be cut offered the information shown in figure. Use the information in these graphs to answer the question.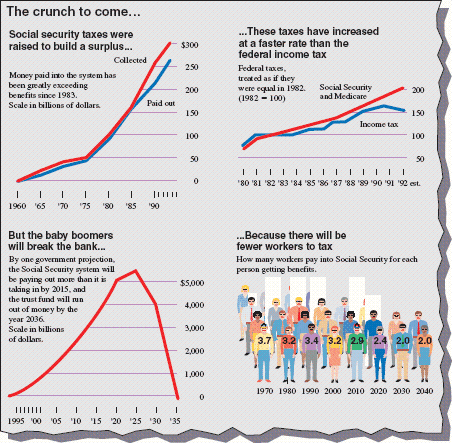 There seems to be an error in one of the three line graphs. What is it?
What will be an ideal response?
The line graph at right begins at 50 rather than 0.
Mathematics
You might also like to view...
Sketch a graph of the function.f(x) = 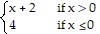
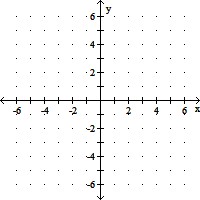
A. 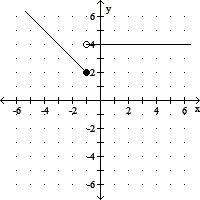
B. 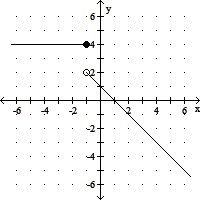
C. 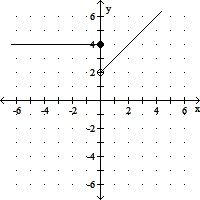
D. 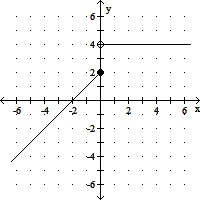
Mathematics
Write interval notation.{ x ? x ? 2 }
A. (-?, 2] B. (2, ?) C. (-?, 2) D. [2, ?)
Mathematics
Solve the equation.2 + log3(2x + 5) - log3 x = 4
A. 
B. 
C. 
D. 
Mathematics
Set up the percent proportion, and write "unknown" for the value that is not given. Recall that the percent proportion is  =
=  . Do not try to solve for any unknowns.93% of what is 35?
A.  =
= 
B.  =
= 
C.  =
= 
D.  =
= 
Mathematics