Using Figure 1 above, if the aggregate demand curve shifts from AD2 to AD3 the result in the long run would be: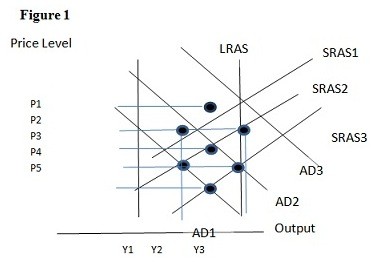
A. P2 and Y2.
B. P1 and Y2.
C. P4 and Y2.
D. P1 and Y1.
Answer: B
You might also like to view...
Use the following graph to answer the next question.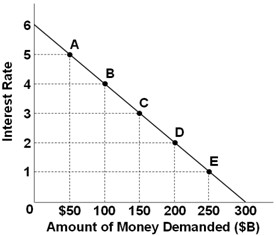 If the equilibrium interest rate is 4%, the supply of money must be
A. $100 billion. B. $150 billion. C. $200 billion. D. $250 billion.
In the graph for the consumption function, the 45-degree line
A) contains only a consumption component.
B) represents both planned consumption and planned investment.
C) shows various combinations where planned consumption equals real disposable income.
D) reflects a decreasing APC as real disposable income rises.
Which of the following is true concerning the distribution of income?
a. Various measures of income inequality can be used to objectively determine the fairness of an income distribution. b. When the political process is democratic, income transfer programs will redistribute income from the rich to the poor. c. The fairness of an income distribution is a normative concept; it cannot be determined objectively by economic criteria. d. Income inequality is the fairest method to allocate income.
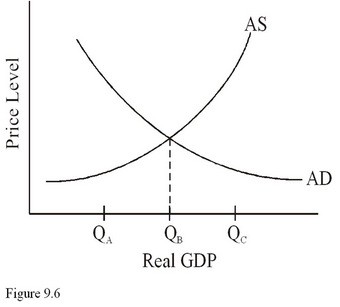 In Figure 9.6, if full employment occurs at QC, then aggregate demand is
A. Too small, causing cyclical unemployment. B. Too small, causing demand-pull inflation. C. Too great, causing cyclical unemployment. D. Just right.