Refer to the below graph of the supply and demand for agricultural products. If point 1 reflects the supply and demand for agricultural products in the U.S. in the 1950s, then which point would best characterize long-run change in the equilibrium for agricultural products since that time?
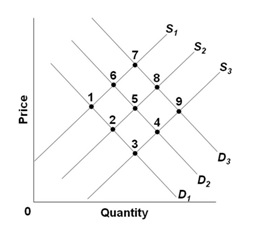
A. 2
B. 4
C. 7
D. 8
B. 4
You might also like to view...
Tariffs and import quotas both result in
A) lower levels of domestic production. B) the domestic government gaining revenue. C) lower levels of imports. D) higher levels of domestic consumption.
In the year 2012, Shinzo Abe became prime minister of Japan, promising bold policies to improve Japan's economy. What was the focus of his policies and how did they affect Japan's trade position?
What will be an ideal response?
When small firms in a concentrated industry merge, it will increase the Herfindahl-Hirshman Index but not change the four firm concentration ratio
a. True b. False Indicate whether the statement is true or false
Consider a regulated natural monopoly. If the regulatory commission wants to establish a fair-return price, then it should set a price ceiling where the demand curve crosses the monopoly's long-run:
A. marginal revenue curve. B. average revenue curve. C. marginal cost curve. D. average cost curve.