The ________ plots the relationship between prices and the quantity producers are willing to sell
A) isoquant B) indifference curve C) demand curve D) supply curve
D
You might also like to view...
Retirement savings accounts, such as IRAs, help increase economic growth because
A) they encourage international trade. B) government invests them. C) they keep the interest rates high. D) people have an incentive to work harder and longer hours to save for the future. E) savings finances investment.
An economic variable that is measured per unit of time, such as spending per year, is known as a: a. stock variable
b. periodic variable. c. dummy variable. d. flow variable. e. controlled variable.
If this firm produced at its most efficient output level it would produce _______ units.
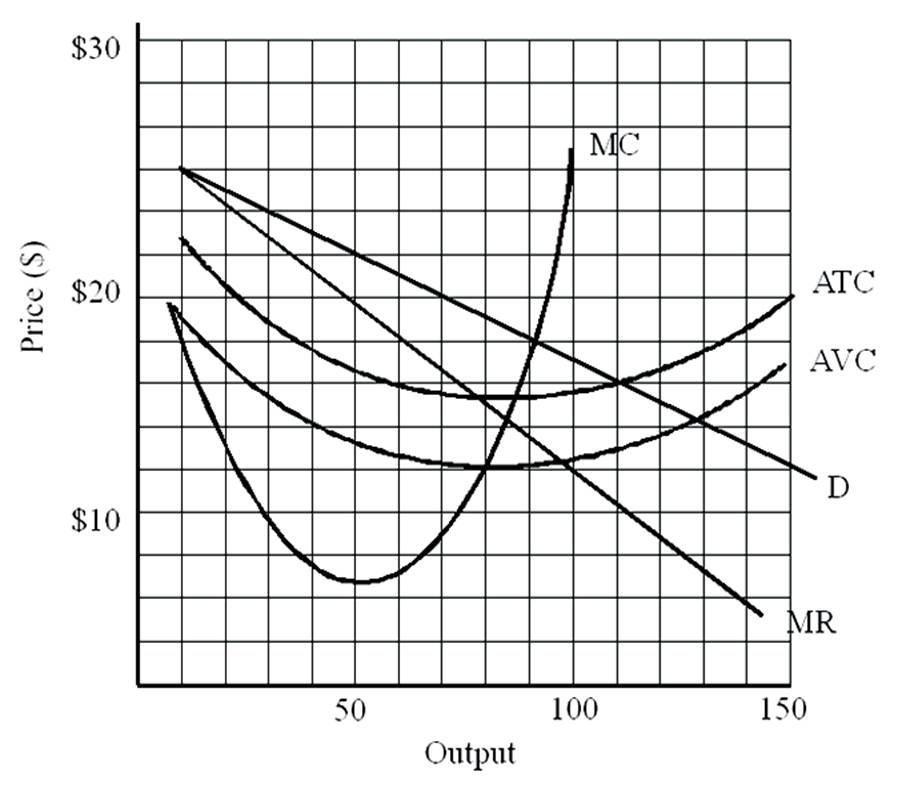
A. 50
B. 80
C. 115
D. 140
Use a saving-investment diagram to explain what happens to saving, investment, and the real interest rate in each of the following scenarios in a closed economy.(a)Current output rises due to a temporary productivity increase.(b)The tax code changes so that business firms face higher tax rates on their revenue (offset by other lump-sum tax changes so there's no overall change in tax revenue).(c)The government increases spending temporarily for a one-year project to turn mercury into gold.(d)The average educational level rises, inducing an increase in the future marginal productivity of capital.
What will be an ideal response?