Refer to the graph shown. When market supply shifts from S0 to S1, the revenue gain to suppliers resulting from increased quantity demanded is shown by area: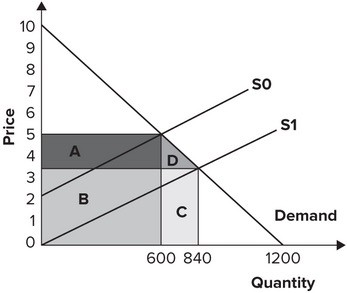
A. A.
B. B.
C. C.
D. D.
Answer: C
You might also like to view...
In a second-price auction, the winner pays
A) the second-to-last bid it made. B) the average of the top two bids. C) the amount bid by the runner-up. D) None of the above.
Suppose that goods X and Y are substitutes and the price of good Y falls. We would then expect
A) the quantity of good Y demanded to increase and the demand for good X to increase also. B) an increase in the demand for good X and a decrease in the quantity of good Y demanded. C) an increase in the quantity demanded of good Y and a decrease in the demand for good X. D) an increase in the demand for both good X and good Y.
If the economy is simultaneously in long-run and short-run equilibrium, which of the following is true?
a. Aggregate quantity supplied is greater than potential output. b. Aggregate quantity demanded is less than potential output. c. Aggregate quantity demanded is equal to potential output. d. The aggregate demand curve is horizontal at the potential output level.
Which of the following is NOT an example of a flow variable?
A. inventory investment B. planned investment C. The federal deficit D. capital stock