Use the graph of the function f(x) to locate the local extrema and identify the intervals where the function is concave up and concave down.
A. Local maximum at x = 3; local minimum at x = -3 ; concave up on (0, -3) and (3, ?); concave down on (-3, 3)
B. Local minimum at x = 3; local maximum at x = -3 ; concave down on (0, ?); concave up on (-?, 0)
C. Local minimum at x = 3; local maximum at x = -3 ; concave up on (0, -3) and (3, ?); concave down on (-3, 3)
D. Local minimum at x = 3; local maximum at x = -3 ; concave up on (0, ?); concave down on (-?, 0)
Answer: D
You might also like to view...
Evaluate the factorial expression.20!
A. 1.2165 × 10¹⁷ B. 4.8658 × 10¹⁸ C. 2.4329 × 10¹⁸ D. 1.2165 × 10¹⁸
Multiply and simplify any radicals in your answer. Assume that all variables represent positive real numbers.(4 )(4
)(4 )
)
A. 4y2
B. 16y
C. 16
D. 16y2
Find all real numbers that satisfy the equation. Round approximate answers to the nearest hundredth.2 sin(?x) = 
A. {x|x = 0.33 + k or x = 1.67 + k} B. {x|x = 0.33 + k or x = 0.67 + k} C. {x|x = 0.33 + 2k or x = 0.67 + 2k} D. {x|x = 0.17 + 2k or x = 0.83 + 2k}
Solve.The population P, in thousands, of Jonesburg is given byP(t) =  ,
where t is the time, in months.Graph the function on the interval [0,?) and complete the following:P(t) ?
,
where t is the time, in months.Graph the function on the interval [0,?) and complete the following:P(t) ?  as t ? ?.
A. 
P(t) ? 50 as t ? ?.
B. 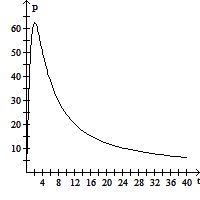
P(t) ? 0 as t ? ?.
C. 
P(t) ? 1 as t ? ?.
D. 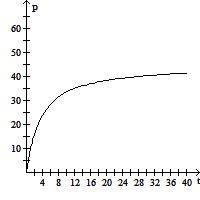
P(t) ? 45 as t ? ?.