The graph below indicates the number of new cases of Chalk Dust Disease (CDD) diagnosed each month in the Mathland. Let T(t) represent the total number of new cases per month, F(t) the number of new cases per year among algebraists, G(t) the number of new cases per year among geometers, and t the number of years since January 1, 1990.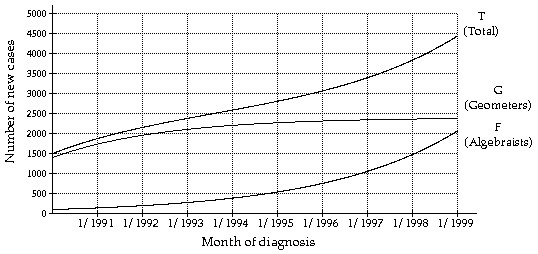 Estimate T(1) and interpret its meaning.
A. 140; In January, 1991, there were about 140 new cases of CDD diagnosed among algebraists.
B. 1900; In January, 1991, there were about 1900 new cases of CDD diagnosed among geometers.
C. 1900; In January, 1991, there were about 1900 new cases of CDD diagnosed.
D. 1700; In January, 1991, there were about 1700 new cases of CDD diagnosed among geometers.
Answer: C
You might also like to view...
Write the equation of the line in standard form.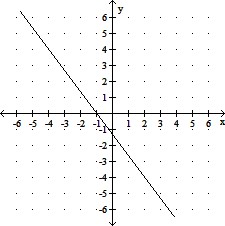
A. 4x + 3y = -4
B. y = -  x -
x - 
C. 4x - 3y = -4
D. y =  x -
x - 
Find the equation of the line with the given properties.Passes through (-4, -1) and has an inclination of 45°
A. x + y - 3 = 0 B. x - y + 3 = 0 C. 3x - y = 0 D. 3x + y - 3 = 0
Use the simple interest formula to determine the missing value.Loan amount of $2800 borrowed at an annual percentage rate of r% in a simple interest account for 7 years resulting in a future value of $1372.00
A. r = 14.29% B. r = 0.07% C. r = 18.4% D. r = 7%
Answer the following statement(s) true (T) or false (F)
When the goal of a lesson is to have students understand the processes of mathematical problem solving, withholding calculators could result in students becoming bogged down in computations.