Refer to Figure 16-11. If government purchases increase by $100 billion and lead to an ultimate increase in aggregate demand as shown in the graph, the difference in real GDP between point A and point B will be
A) more than $100 billion.
B) less than $100 billion.
C) $100 billion.
D) There is insufficient information given here to draw a conclusion.
A
You might also like to view...
In the IS equation, which of the following is an endogenous variable?
A) autonomous investment B) autonomous net exports C) taxes D) all of the above E) none of the above
Refer to the above figure. An external cost exists. The amount of that cost is represented by
A) P2. B) Q1. C) the vertical distance between point A and the supply curve S1. D) the distance between C and A.
What happens to the price of the product and total revenue for a perfectly competitive firm if it doubles the amount of output it supplies in the market?
What will be an ideal response?
Figure 10-8
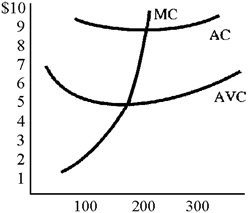
In the short run, the firm in Figure 10-8 will shut down if the price falls below
a.
$8.
b.
$6.
c.
$5.
d.
$1.