Which of the following examples is shown in this graph?
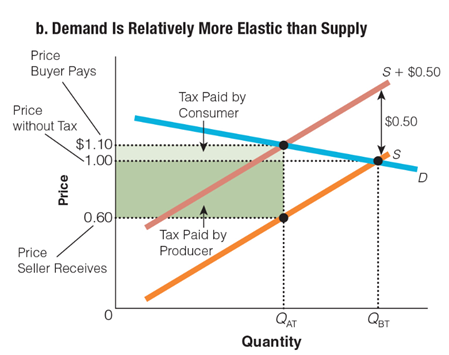
a. The buyer pays $0.50 of a $0.50 tax.
b. The buyer pays $0.40 of a $0.50 tax.
c. The seller pays $0.50 of a $0.50 tax.
d. The seller pays $0.40 of a $0.50 tax.
d. The seller pays $0.40 of a $0.50 tax.
You might also like to view...
Suppose the total cost of producing 40,000 flash drives is $120,000, and the fixed cost is $30,000
a. What is the variable cost? b. When output is 40,000, what are the average variable cost and the average fixed cost? c. Assuming the cost curves have the usual shape, is the dollar difference between the average total cost and the average variable cost greater when the output is 40,000 flash drives or when the output is 60,000 flash drives? Explain.
Refer to the table below. The expected value of the price of the input in Country A is ________ the expected value of the input in Country B.
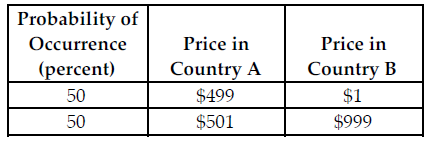
The above table provides the probability distribution of price of an input next year in Country A and Country B.
A) greater than
B) twice
C) the same as
D) less than
Horatio can produce either a combination of 15 bird houses and 25 wind chimes or a combination of 30 bird houses and 15 wind chimes. If he now produces 30 bird houses and 15 wind chimes, what is the opportunity cost of producing an additional 10 wind
chimes? A) 2 bird houses B) 15 bird houses C) 30 bird houses D) 45 bird houses
If marginal product is less than average product, then
A. marginal product must be decreasing. B. average product must be increasing. C. marginal product must be increasing. D. marginal product could either be increasing or decreasing.