Solve the problem.The following data represents the average percent of possible sunshine for a certain city in Indiana. 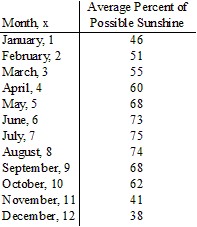 Draw a scatter diagram of the data for one period. Find the sinusoidal function of the form
 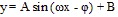 that fits the data. Draw the sinusoidal function on the scatter diagram. Use a graphing utility to find the sinusoidal function of best fit. Draw the sinusoidal function of best fit on the scatter diagram.
What will be an ideal response?
y = 15.99 sin (0.57x - 2.29) + 60.62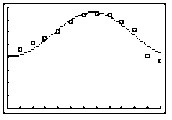
You might also like to view...
Find an equation for the sphere with the given center and radius.Center (-10, 0, 0), radius = 8
A. x2 + y2 + z2 + 20x = 8 B. x2 + y2 + z2 + 20x = -36 C. x2 + y2 + z2 - 20x = -36 D. x2 + y2 + z2 - 20x = 8
Solve the problem.Use Newton's Law of Cooling to find the temperature in the following case. A loaf of bread is removed from an oven at  and cooled in a room whose temperature is
  . If the bread cools to
  in 20 minutes, how much longer will it take the bread to cool to
A. ? 16 minutes B. ? 23 minutes C. ? 3 minutes D. ? 4 minutes
Find the specified domain.Find the domain of (fg)(x) when f(x) =  and g(x) =
  .
.
A. (-?, ?)
B. 
C. [0, ?)
D. 
Simplify the algebraic expression by collecting and combining like terms.4x - 3y - 7x - 8y
A. 4x - 7x - 3y - 8y B. -3x - 11y C. -11x - 3y D. -14xy