Graph.y = 2
A. 
B. 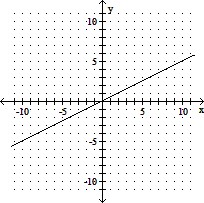
C. 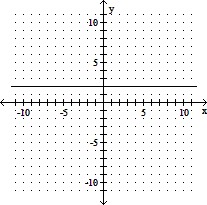
D. 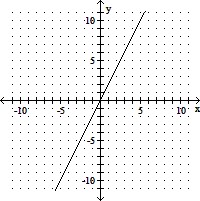
Answer: C
Mathematics
You might also like to view...
In a biology class, the following test scores were recorded for a student: 73, 65, 61, 61, 73, 75. Find the mean, median, and mode for the data.
A. mean: 68, median: 69, mode: 61 and 73 B. mean: 69, median: 69, mode: 61 C. mean: 69, median: 68, mode: 73 D. mean: 68, median: 61, mode: 75
Mathematics
The bar graph shows the number of tickets sold each week by the garden club for their annual flower show. Use the graph to answer the question(s).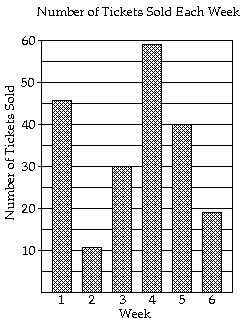 How many more tickets were sold during week 4 than week 3?
A. 39 tickets B. 34 tickets C. 89 tickets D. 29 tickets
Mathematics
Convert to a logarithmic equation.103 = 1000
A. log3 = 10
= 10
B. log10 = 1000
C. log10 = 3
= 3
D. log3 = 1000
Mathematics
Graph the function.f(x) = -x2(x - 1)(x + 1)
A. 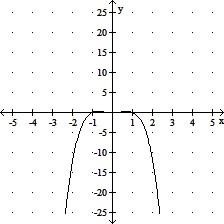
B. 
C. 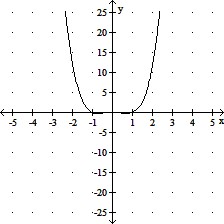
D. 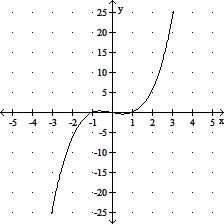
Mathematics