Plot the graph and find the value from the graph.The town of Appleville recorded the following dates and populations.YEAR POPULATION (in thousands)1980 23.51985 251990 281995 34 Draw a graph of the population as a function of time. What is the approximate population of Appleville in 2000?
A. 41,000
B. 51,000
C. 46,000
D. 36,000
Answer: C
You might also like to view...
Provide an appropriate response.The standard normal probability density function is defined by f(x) =  e- x2/2. (a) Show that
 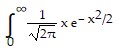 dx =
dx =  .(b) Use the result in part (a) to show that the standard normal probability density function has mean 0.
What will be an ideal response?
The following table shows the height H, in centimeters, of a certain type of flower when it is t weeks old.
?
 258101315
 6.1119.7638.5541.541.3242.93?
Based on the table, what do you expect is the limiting value of H?
6.1119.7638.5541.541.3242.93?
Based on the table, what do you expect is the limiting value of H?
What will be an ideal response?
Find the least common multiple.2, 10
A. 20 B. 5 C. 10 D. 2
Provide an appropriate response.Suppose Mr. Takegawa owes Ms. Perez three sums of money: $1000 due in 2 years, $1500 due in 5 years, and $2000 due in 8 years. Suppose he would rather pay her $2000 now and the rest in 3 years. If the interest rate is 6% compounded annually, how much will he owe in 3 years?
Fill in the blank(s) with the appropriate word(s).