Refer to Figure 7.6. Which graph represents decreasing returns to scale?
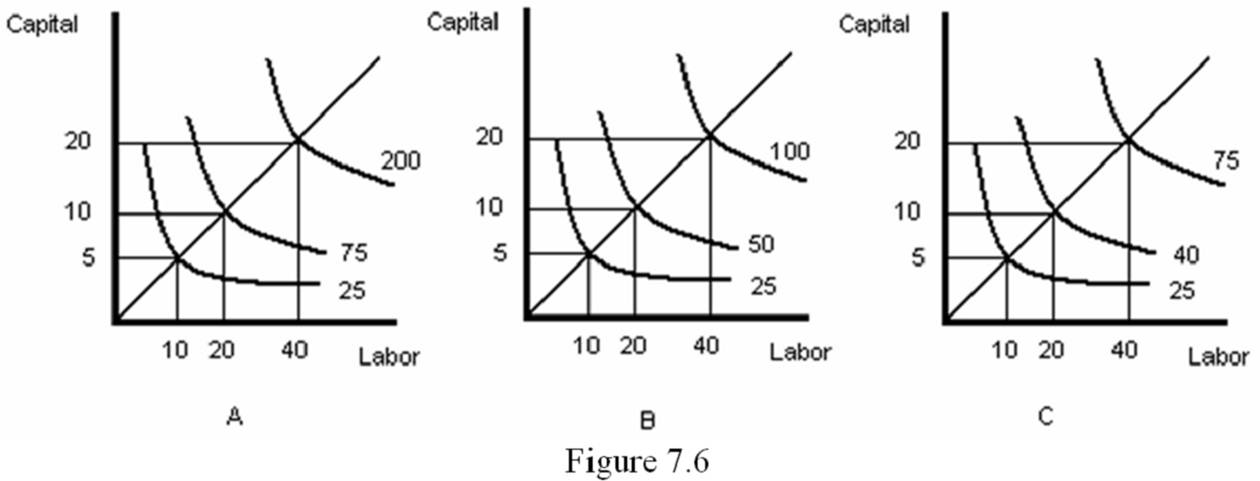
A. A
B. B
C. C
D. Both graph A and graph C
C. C
You might also like to view...
While deficits in the United States through the 1970s, 1980s and early 1990s were high relative to our historical peacetime experience, they
a. were been below average for large industrial countries. b. were above average when compared to other large industrial countries. c. were about average for large industrial countries. d. were the lowest when compared to other large industrial countries.
Use the following statements to answer this question: I. An increase in the firm's fixed costs will also shift the firm's short-run supply curve to the left. II
An increase in the firm's fixed costs will not shift the firm's short-run supply curve to the right or left, but it may alter how much of the marginal cost curve is used to form the short-run supply curve. A) I and II are true. B) I is true and II is false. C) II is true and I is false. D) I and II are false.
According to recent study, air pollution on average is greater outdoors than indoors
Indicate whether the statement is true or false
Gross Domestic Product (GDP) is the total market value of all
A) final goods and services produced annually within a country's borders. B) final and intermediate goods and services produced annually within a country's borders. C) intermediate goods and services produced annually within a country's borders. D) final goods produced every month within a country's borders.