Solve the problem.The following data represents the height (in inches) and weight (in pounds) of 9 randomly selected adults. 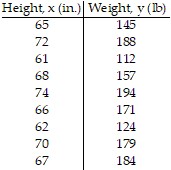 Graph the data on a scatter diagram treating height as the independent variable. Find an equation of the line containing the points (62, 124) and (70, 179). Express the relationship using function notation. Graph the line on the scatter diagram. Interpret the slope of the line. Use the line to predict the weight of a person who is 67.9 inches tall. Round to the nearest pound.
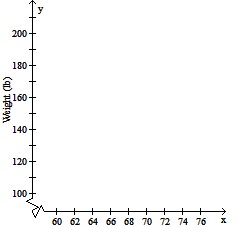 Height (inches)
What will be an ideal response?
| Height (inches) |
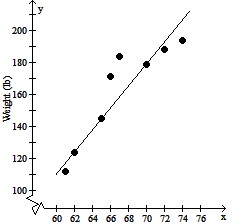
W(h) = 6.875h - 302.25;
If height is increased by one inch, then weight will increase by 6.875 pounds;
165 lb
Mathematics
You might also like to view...
Find the area of the specified region.Inside the three-leaved rose r = 8 cos 3?
A.  ?
?
B. 8?
C. 32?
D. 16?
Mathematics
Find the total area of the region between the curve and the x-axis.y =  ; 1 ? x ? 4
A. 
B. 2
C. 4
D. 
Mathematics
Rewrite as a single logarithm.2logb m -  logb n +
  logb j - 4logb k
A. logb 
B. logb (2m -  n +
n +  j - 4k)
C. logb 
D. logb 
Mathematics
Solve the equation. = -9
= -9
A. {-81} B. ? C. {18} D. {81}
Mathematics