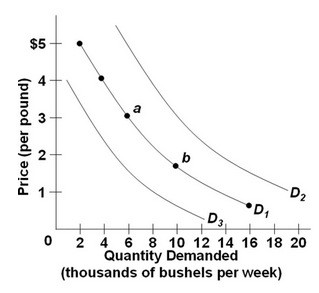
 Refer to the above diagram, which shows three demand curves for coffee. Which would cause the change in the demand for coffee illustrated by the shift from D1 to D2?
A. An increase in consumer incomes
B. An increase in the price of sugar
C. A decrease in the price of tea
D. A technological improvement in the production of coffee
Answer: A
You might also like to view...
Which of the following correctly ranks the amounts from largest to smallest?
A. total output, output per person, average labor productivity B. output per person, total output, average labor productivity C. total output, average labor productivity, output per person D. average labor productivity, output per person, total output
What preconceptions do you have of "developing countries"? What do those preconceptions lead you to expect from this course?
What will be an ideal response?
If the government wishes to increase GDP by $1,000b, and the MPC is 0.6, it should increase its spending by:
A. $250b. B. $400b. C. $600b. D. $1,000b.
When a company's cost of compliance with health and safety legislation associated with labor resources increases, its demand for labor also increases
a. True b. False Indicate whether the statement is true or false