Graph the equation.y = 2x + 3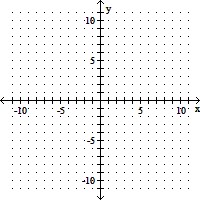
A. 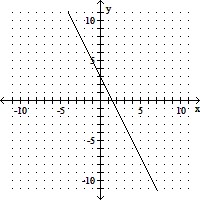
B. 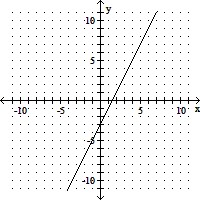
C. 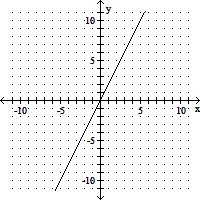
D. 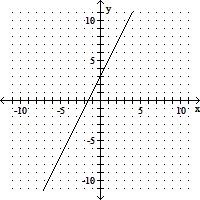
Answer: D
You might also like to view...
Decide whether or not the set is closed under addition.{0, 1}
A. Closed B. Not closed
Solve.Suppose economists use as a model of a country's economy the function N(x) = 0.6898x + 5.9243,where N represents the consumption of products in billions of dollars and x represents disposable income in billions of dollars. a. Identify the dependent and independent variables.b. Evaluate N(8.67)and explain what it represents.
A. a. The dependent variable is the number of billions of dollars, N, and the independent variable is the disposable income in billions of dollars. b. N(8.67) = $3.8 billion; According to the model, the number of billions of dollars for the consumption of products is $3.8 billion. B. a. The dependent variable is the number of billions of dollars, N, and the independent variable is the disposable income in billions of dollars. b. N(8.67) = $11.9 billion; According to the model, the number of billions of dollars for the consumption of products is $11.9 billion. C. a. The dependent variable is the number of billions of dollars, N, and the independent variable is the disposable income in billions of dollars. b. N(8.67) = $4.0 billion; According to the model, the number of billions of dollars for the consumption of products is $4.0 billion. D. a. The dependent variable is the number of billions of dollars, N, and the independent variable is the disposable income in billions of dollars. b. N(8.67) = $5.2 billion; According to the model, the number of billions of dollars for the consumption of products is $5.2 billion.
Use the graph of f to sketch a graph of the inverse of f using a dashed curve.
A. 
B. 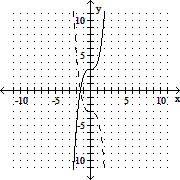
C. 
D. 
Add or subtract. -
- 
A. 
B. 
C. 
D. 