The line graph shows the recorded hourly temperatures in degrees Fahrenheit at an airport. Use the graph to answer the question.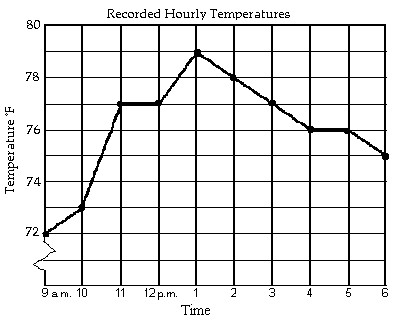 During which hour did the temperature increase the most?
A. 1 p.m. to 2 p.m.
B. 9 a.m. to 10 a.m.
C. 10 a.m. to 11 a.m.
D. 12 p.m. to 1 p.m.
Answer: C
Mathematics
You might also like to view...
Use an Euler diagram to determine whether the argument is valid or invalid.Some cars are considered sporty.Some cars are safe at high speeds.? Some sports cars are safe at high speeds.
A. Invalid B. Valid
Mathematics
Express the number in decimal notation.7 × 10-7
A. 0.0000007 B. -700,000 C. 0.00000007 D. 0.000007
Mathematics
Perform the indicated operation. Write the result in the form a + bi.(3 + 6i) - (-9 + i)
A. -6 + 7i B. 12 + 5i C. 12 - 5i D. -12 - 5i
Mathematics
Provide an appropriate response.Solve the equation containing an absolute value:  = 10
= 10
A. x = -3, x = 
B. x = ±3
C. x = +3, x = -
D. no solution
Mathematics