Of the collection of supply and demand diagrams in Figure 2.2, which one shows the result of a decrease in the price of a substitute for a good?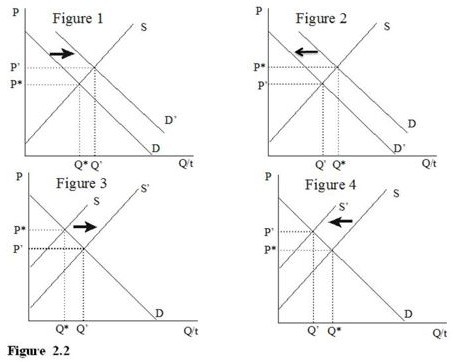
A. Figure 1
B. Figure 2
C. Figure 3
D. Figure 4
Answer: B
You might also like to view...
The Sherman Act of 1890
A) established the corporate income tax. B) prohibited price-setting agreements among sellers. C) required employers to bargain collectively with labor unions. D) set maximum prices railroads could charge interstate shippers. E) set minimum prices railroads could charge without being guilty of unfair trade practices.
An increase in the marginal revenue product schedule for labor
A. means that the marginal physical product of labor rose. B. means that more labor is demanded by the firm. C. means that the demand for the final product has fallen. D. means that labor productivity has risen.
When both inflation and unemployment are concerns, supply-side economists argue in favor of policies to shift the
A. aggregate supply curve to the right and lower the CPI, while Keynesian fiscal policy would shift the aggregate demand curve to the right and increase the CPI. B. aggregate supply curve to the left and raise the CPI, while Keynesian fiscal policy would shift the aggregate demand curve to the left and decrease the CPI. C. aggregate supply curve to the right and lower the CPI, which is the same policy Keynesian economists would advocate. D. aggregate demand curve to the right because unemployment is a more important concern than inflation.
When an individual quits his job and decides to look for a new job immediately, the labor-force participation rate
A. stays the same. B. increases. C. decreases. D. may increase or decrease, depending on the length of time he/she stays at home.