Add.8 + (-20) + 5 + (-6)
A. -13
B. 39
C. -23
D. -11
Answer: A
Mathematics
You might also like to view...
Construct the specified histogram.In a survey, 20 voters were asked their age. The results are summarized in the frequency table below. Construct a histogram . 

What will be an ideal response?
Mathematics
Add:
9 /30è 6 /30è a. 7.5 /15è b. 10.8 /30è c. 10.8 /60è d. 15 /30è e. 15 /60è
Mathematics
The bar graph below shows the number of students by major in the College of Arts and Sciences. Answer the question.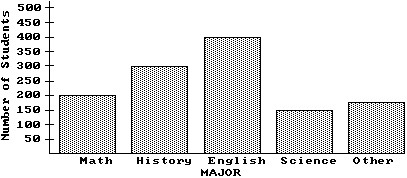 What is the ratio of history majors to the total number of students in the college?
A. 12 to 49 B. 12 to 16 or 3 to 4 C. 12 to 48 or 1 to 4 D. 49 to 8
Mathematics
Perform the indicated operation. Simplify your answers.  -
- 
A. 
B. 
C. 
D. 
Mathematics